Dashboard overview
The dashboard is the home of AcceGuru. It shows the state of your last scan and where to focus.
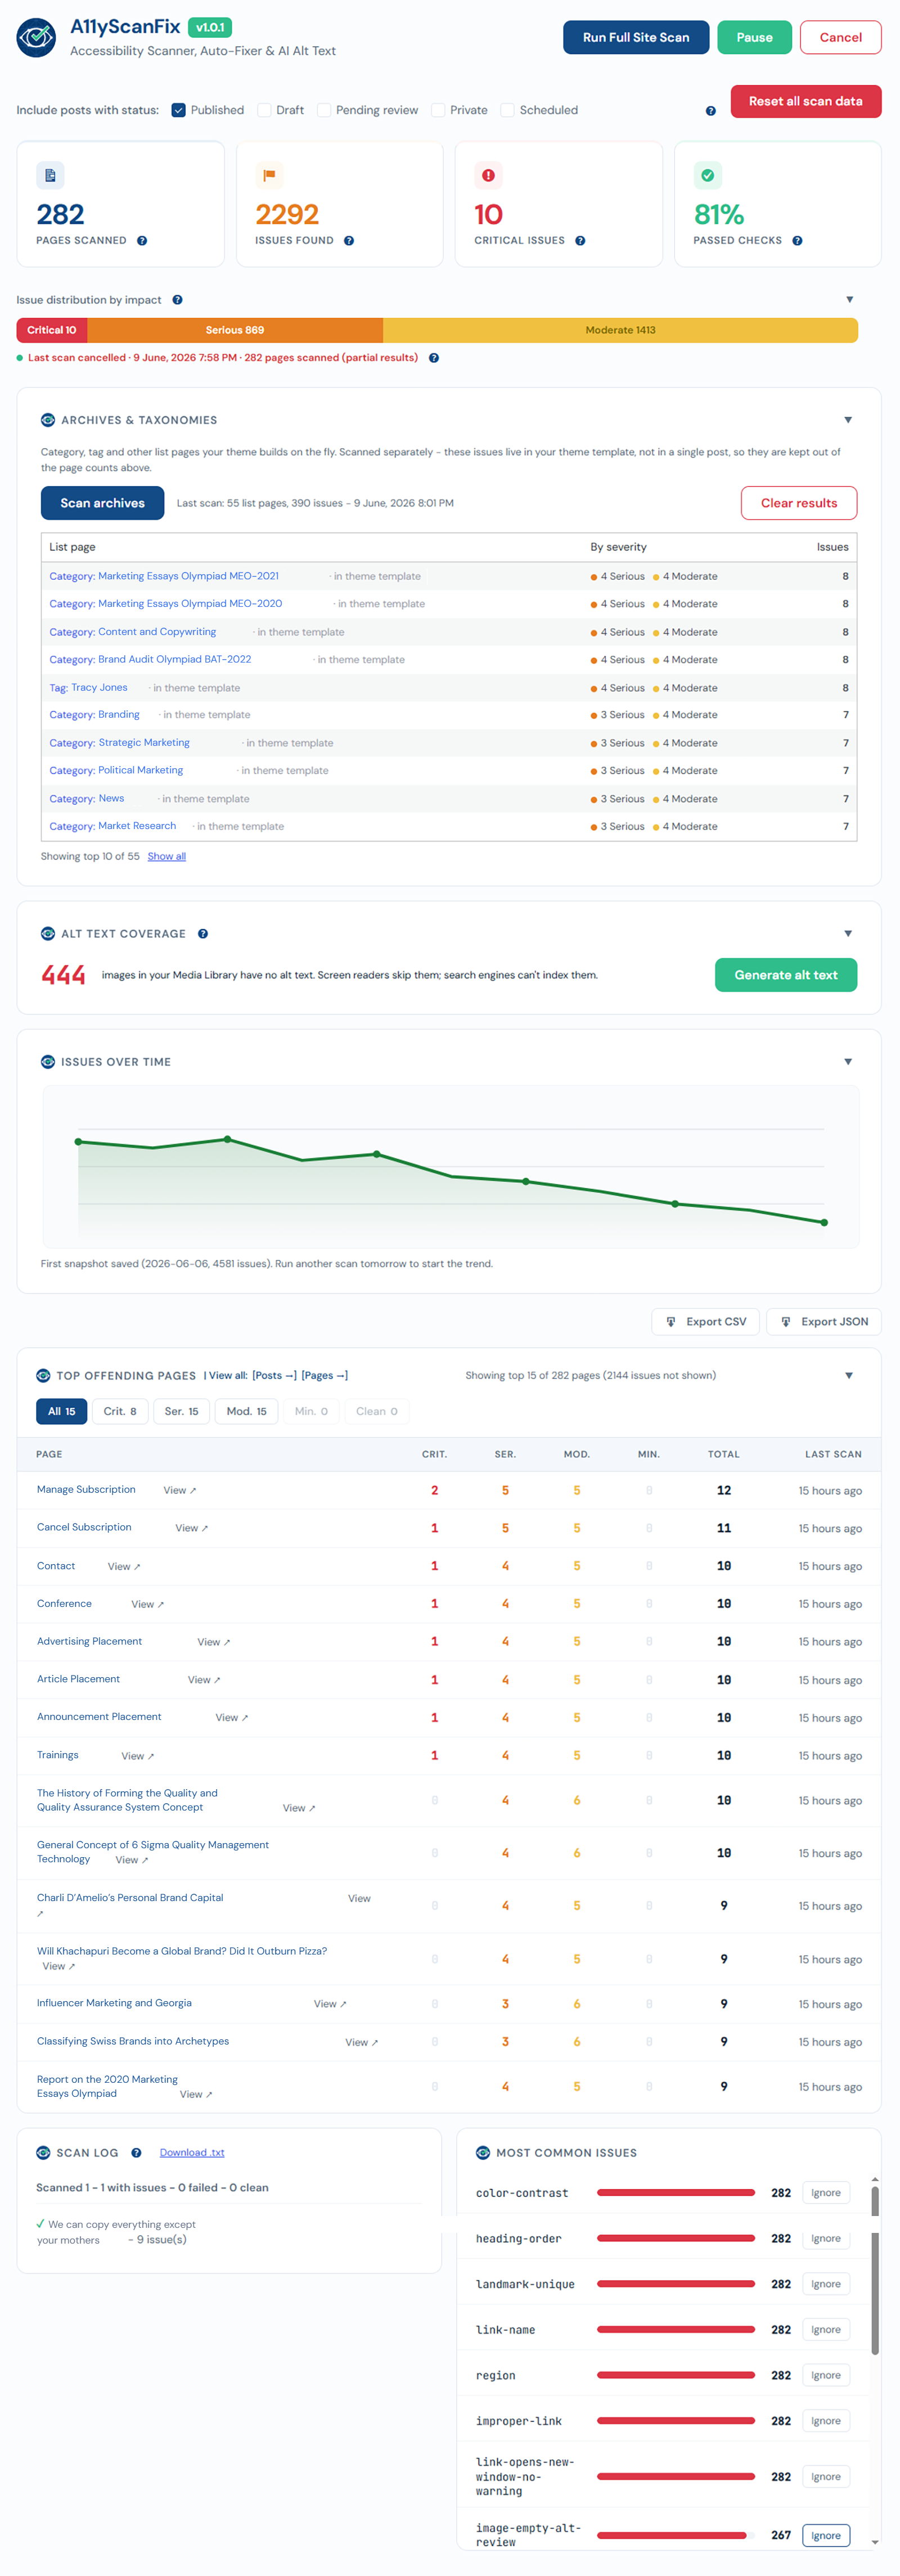
The four cards
- Pages Scanned - how many posts/pages the last run covered.
- Issues Found - total WCAG rule violations across scanned pages.
- Critical - count of critical-impact issues.
- Passed Checks - share of axe-core checks that passed.
After a cancelled (partial) scan, these reflect only the pages that were actually scanned, and a red line marks the run as partial.
Issue distribution by impact
A single bar splits the issues into critical / serious / moderate / minor.
Top Offending Pages
The pages with the most issues, so you know where to start. You can filter by severity.
Most Common Issues
The rules that fail most across the site. Each has an Ignore this rule option to hide a rule you have decided not to act on, site-wide.
Alt Text Coverage
Shows how many Media Library images still lack alt text, with a shortcut to generate them.