Trend chart and export PRO
PRO feature
The trend chart and CSV / JSON export are part of the AcceGuru Pro add-on.
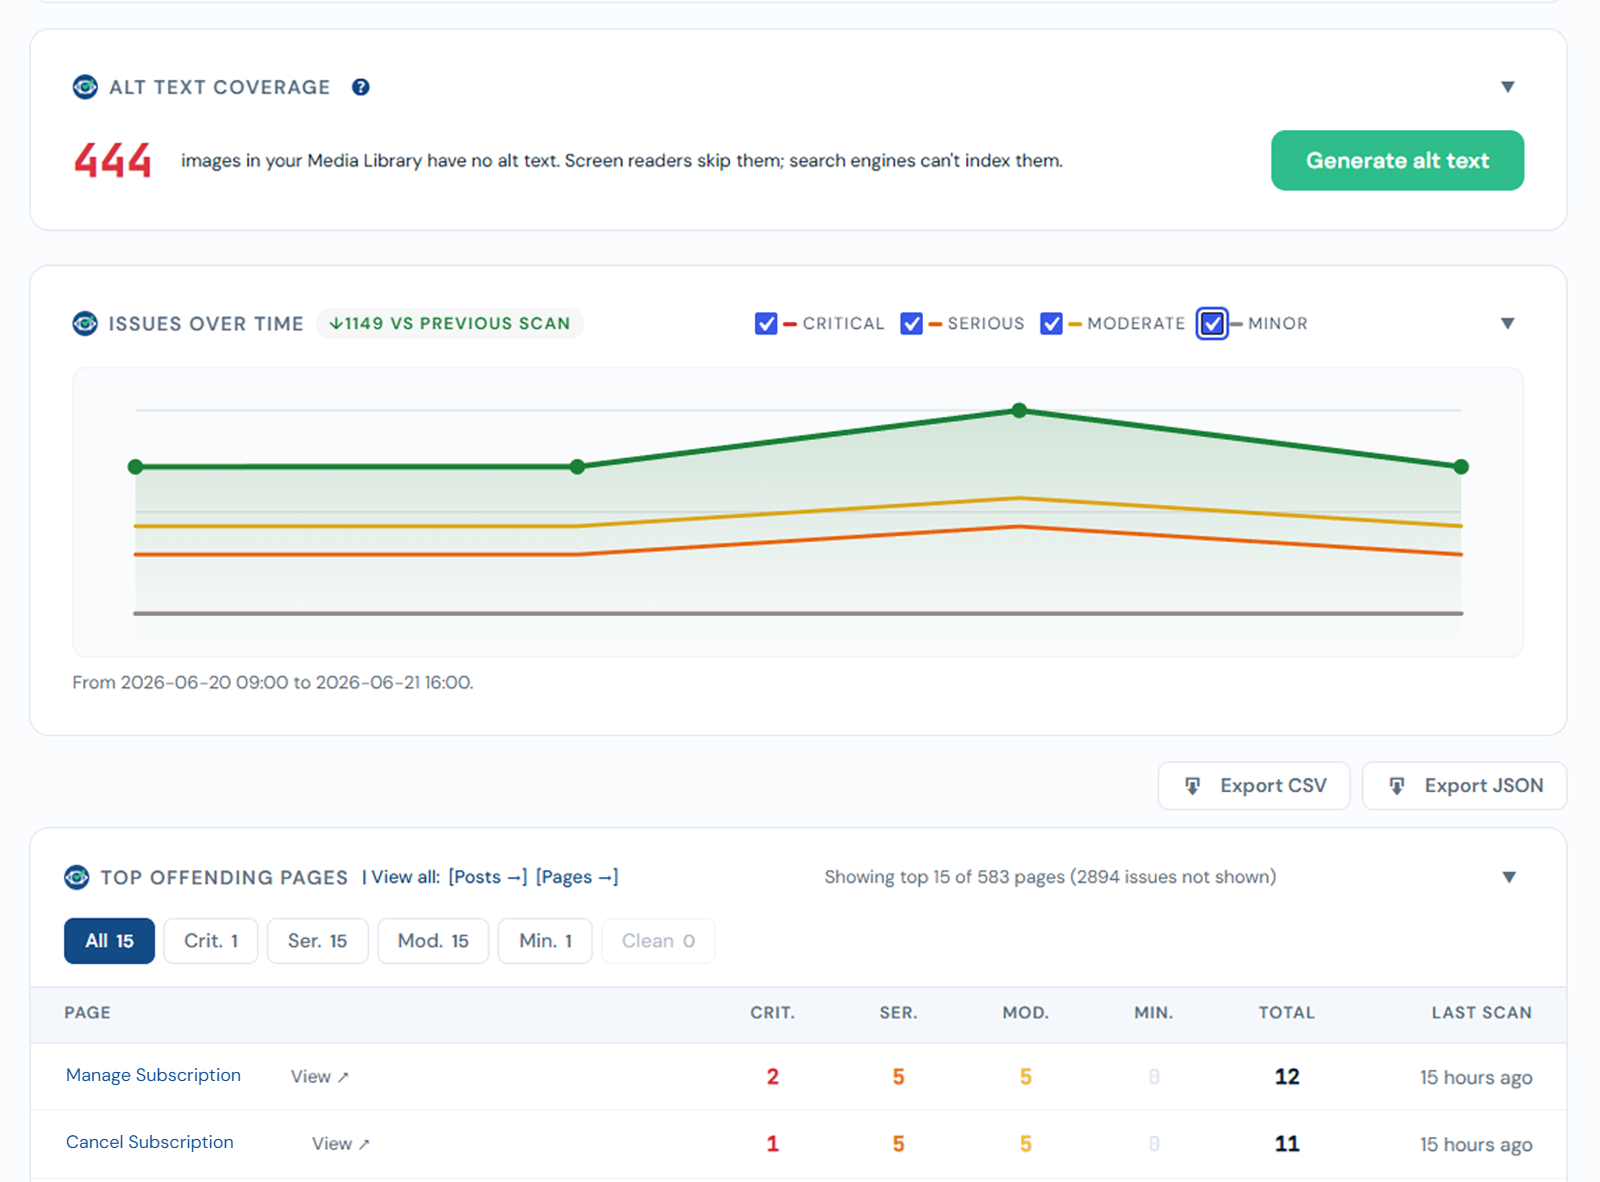
Trend chart - Issues over time
Each completed scan adds a point to the trend, so you can see issues fall as you fix them. Partial (cancelled) scans are not recorded, so the line never shows a false dip. One point per day; re-scanning the same day updates that day's point.
CSV / JSON export
Export the current results for reporting or sharing:
- CSV - one row per issue (page, rule, impact, WCAG tags, selector, help link, scan date). Opens cleanly in Excel.
- JSON - the same data grouped by page, with page and issue counts.
Exports reflect the same dataset as the dashboard, including after a partial scan.